Why you should forget ‘for-loop’ for data science code and embrace vectorization.

We all have used for-loops for majority of the tasks which needs an iteration over a long list of elements. I am sure almost everybody, who is reading this article, wrote their first code for matrix or vector multiplication using a for-loop back in high-school or college. For-loop has served programming community long and steady.
However, it comes with some baggage and is often slow in execution when it comes to processing large data sets (many millions of records as in this age of Big Data). This is particularly true for interpreted language like Python, where, if the body of your loop is simple, the interpreter overhead of the loop itself can be a substantial amount of the overhead.
Fortunately, in almost all major programming ecosystem there is an alternative. Python has a beautiful one.
Numpy, short for Numerical Python, is the fundamental package required for high performance scientific computing and data analysis in Python ecosystem. It is the foundation on which nearly all of the higher-level tools such as Pandas and scikit-learn are built. TensorFlow uses NumPy arrays as the fundamental building block on top of which they built their Tensor objects and graphflow for deep learning tasks (which makes heavy use of linear algebra operations on a long list/vector/matrix of numbers).
Two of the most important advantages Numpy provides, are:
ndarray, a fast and space-efficient multidimensional array providing vectorized arithmetic operations and sophisticated broadcasting capabilities- Standard mathematical functions for fast operations on entire arrays of data without having to write loops
You will often come across this assertion in the data science, machine learning, and Python community that Numpy is much faster due to its vectorized implementation and due to the fact that many of its core routines are written in C (based on CPython framework).
And it is indeed true (this article is a beautiful demonstration of various options that one can work with Numpy, even writing bare-bone C routines with Numpy APIs). Numpy arrays are densely packed arrays of homogeneous type. Python lists, by contrast, are arrays of pointers to objects, even when all of them are of the same type. So, you get the benefits of locality of reference. Many Numpy operations are implemented in C, avoiding the general cost of loops in Python, pointer indirection and per-element dynamic type checking. The speed boost depends on which operations you’re performing. For data science and modern machine learning tasks, this is an invaluable advantage, as often the data set size runs into millions if not billions of records and you do not want to iterate over it using a for-loop along with its associated baggage.
How to prove it definitively with an example of a moderately sized data set?
Here is the link to my Github code (Jupyter notebook) that shows, in a few easy lines of code, the difference in speed of Numpy operation from that of regular Python programming constructs like for-loop, map-function, or list-comprehension.
I just outline the basic flow:
- Create a list of a moderately large number of floating point numbers, preferably drawn from a continuous statistical distribution like a Gaussian or Uniform random. I chose 1 million for the demo.
- Create a
ndarrayobject out of that list i.e. vectorize. - Write short code blocks to iterate over the list and use a mathematical operation on the list say taking logarithm of base 10. Use for-loop, map-function, and list-comprehension. Each time use
time.time()function to determine how much time it takes in total to process the 1 million records.
t1=time.time()
for item in l1:
    l2.append(lg10(item))
t2 = time.time()
print("With for loop and appending it took {} seconds".format(t2-t1))
speed.append(t2-t1)
- Do the same operation using Numpy’s built-in mathematical method (
np.log10) over thendarrayobject. Time it.
t1=time.time()
a2=np.log10(a1)
t2 = time.time()
print("With direct Numpy log10 method it took {} seconds".format(t2-t1))
speed.append(t2-t1)
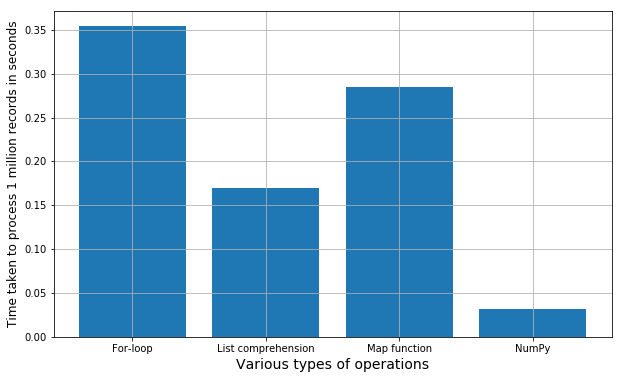
- Store the execution times in a list and plot a bar chart showing the comparative difference.
Here is the result. And, you can repeat the whole process by running all the cells of the Jupyter notebook. Every time it will generate a new set of random numbers, so the exact execution time may vary a little bit but overall the trend will always be the same. You can try with various other mathematical functions/string operations or combination thereof, to check if this holds true in general.
There is an entire open-source, online book on this topic by a French neuroscience researcher. Check it out here.

Bar chart of comparative speeds of execution of simple mathematical operations
If you have any questions or ideas to share, please contact the author at tirthajyoti[AT]gmail.com. Also you can check author’s GitHub repositories for other fun code snippets in Python, R, or MATLAB and machine learning resources.
Bio: Tirthajyoti Sarkar is a semiconductor technologist, machine learning/data science zealot, Ph.D. in EE, blogger and writer.
Original. Reposted with permission
Comments
Post a Comment